The beginning of many great projects start with a researcher saying “that’s odd.” One of these moments led to the runZero concept of the “outlier score”: a single, simple numeric value that quantifies how “different” an asset is compared to its neighbors and, importantly, the discovery of how that difference corresponds to the risk associated with a given asset.
Identifying risky assets is fundamental to successful attack surface management programs, but this process can be challenging due to the quantity and sources of data. We explore how runZero outlier scores can be used to quickly identify risky assets, even in cases where no vulnerability management data is available.
How runZero identifies risky assets #
runZero ingests data from third-party integrations such as vulnerability scanners, device management systems, and security analysis tools, and then combines these data points with our own analysis. This produces a unified numeric risk rank for an asset. In general, the “riskier” an asset appears to be, the higher its rank becomes on the risk scale.
runZero looks for assets that differ significantly from their peers, using multiple dimensions and points of comparison. The more an asset deviates from the site’s “baseline,” the greater its outlier status from runZero’s perspective. This is quantified in a single number, known as the outlier score: the more unusual a device is in its context from the baseline, the higher its outlier metric will be. The outlier metric starts at zero, but has no practical upper bound (though values >600 are fairly rare). Note that for sites with no “common baseline” of assets, no outlier scores are computed. If they were, everything would be an outlier!
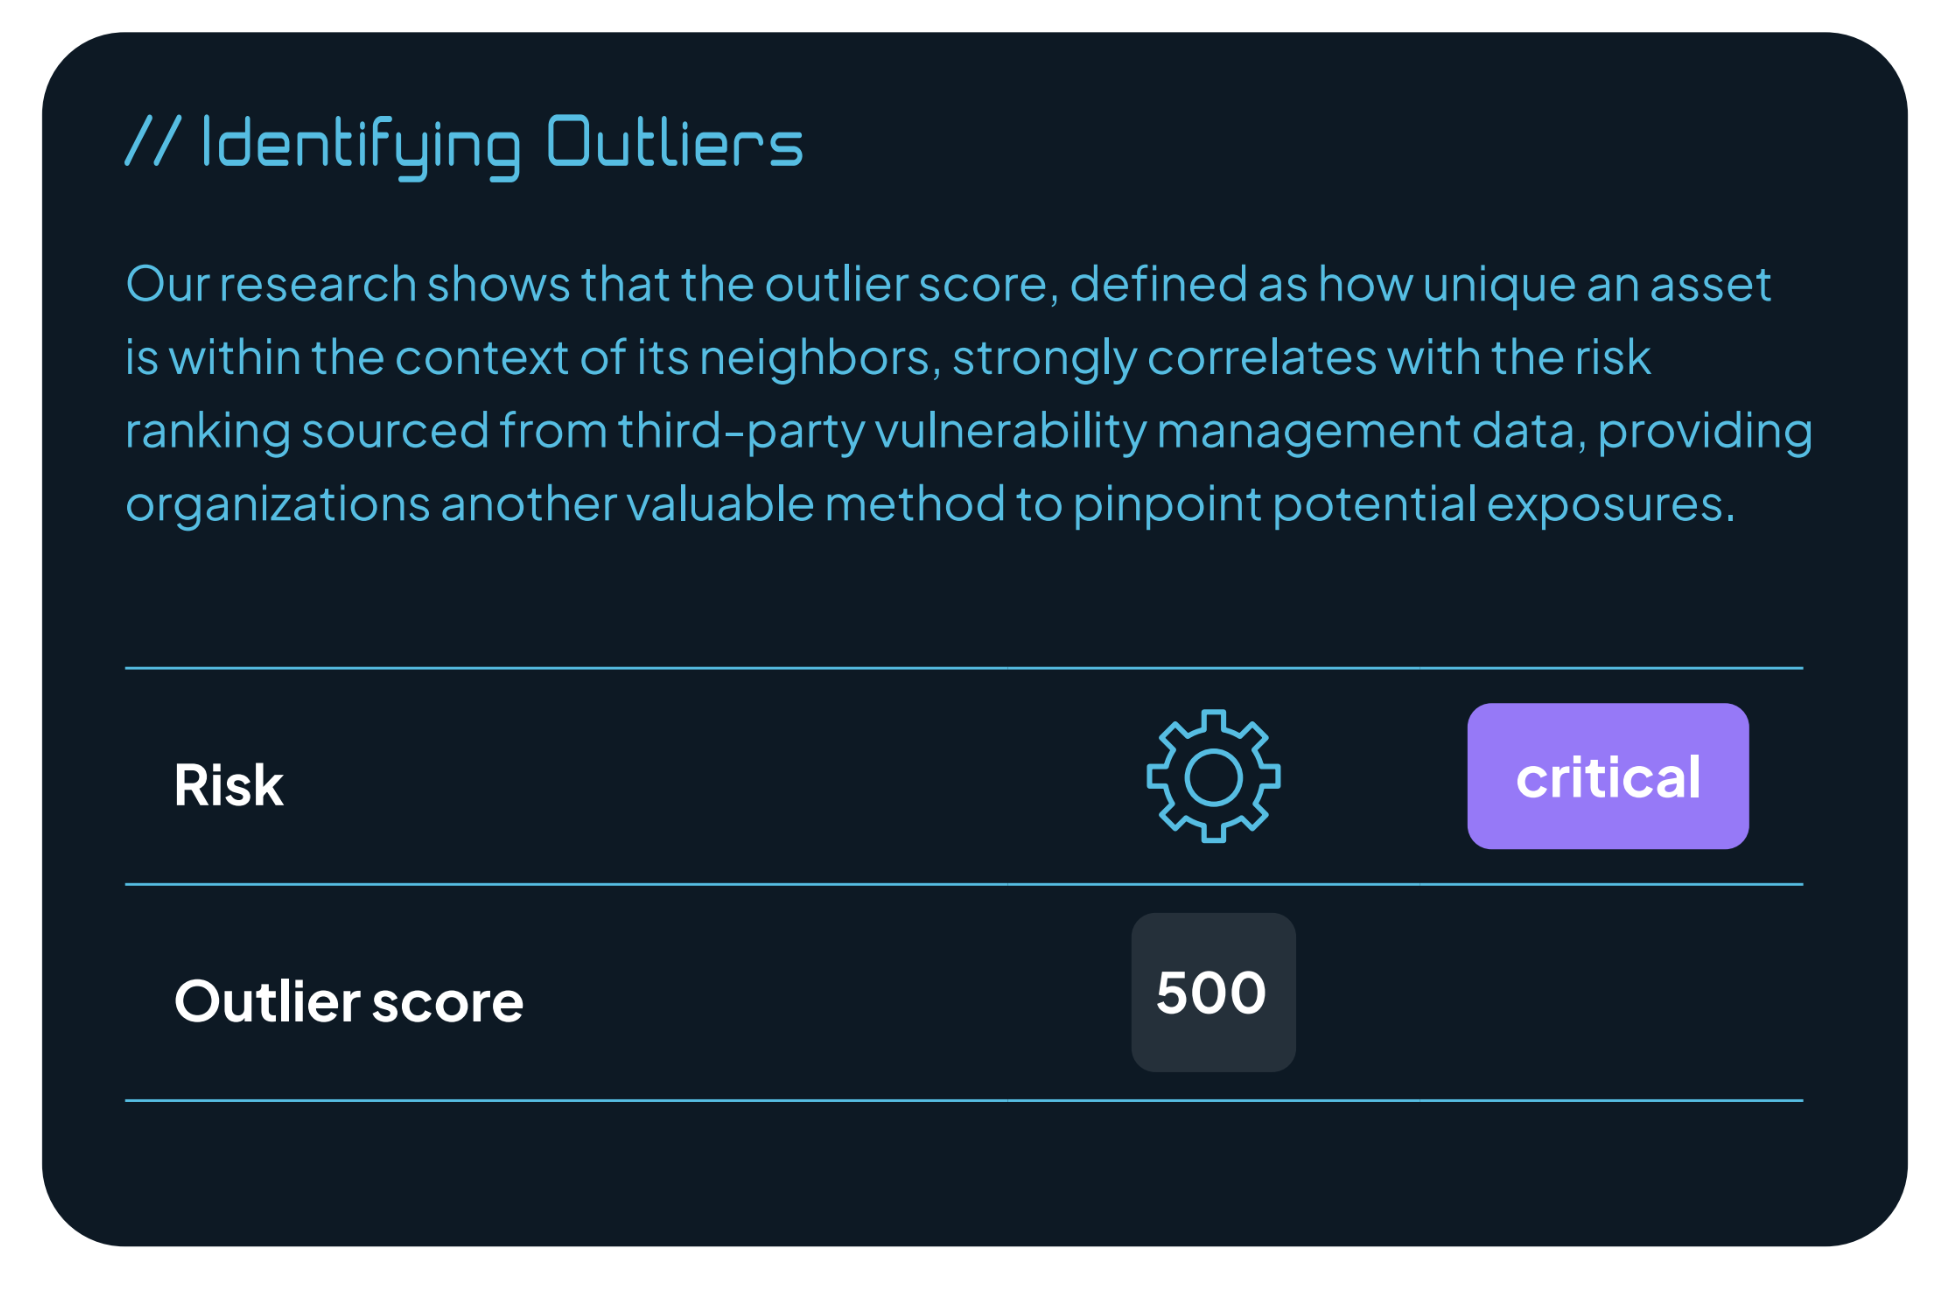
Often, sites will have large numbers of very similar assets – a server farm of systems running Linux and some routers and switches, or an office with a large number of Windows PCs and printers. In those instances, a small number of, or even a single instance of, unusual devices may indicate that there is an asset that has escaped notice and attention by security teams. Identifying outliers breaks through the noise by highlighting assets that merit further investigation by security teams.
Outlier assets predict risk ranking #
runZero observed that outlier scores are strongly predictive of asset risk. An analysis of 680,000 assets across sites in a variety of organizations and settings revealed that this correlation is quite strong.
Figure 1 illustrates the correlation between the average risk rank of an asset with a given outlier score; color intensity indicates overlapping data points. Lines of best fit are provided for all data points (black), and those with an outlier score ≤300; higher outlier scores indicate that an asset is more unusual.
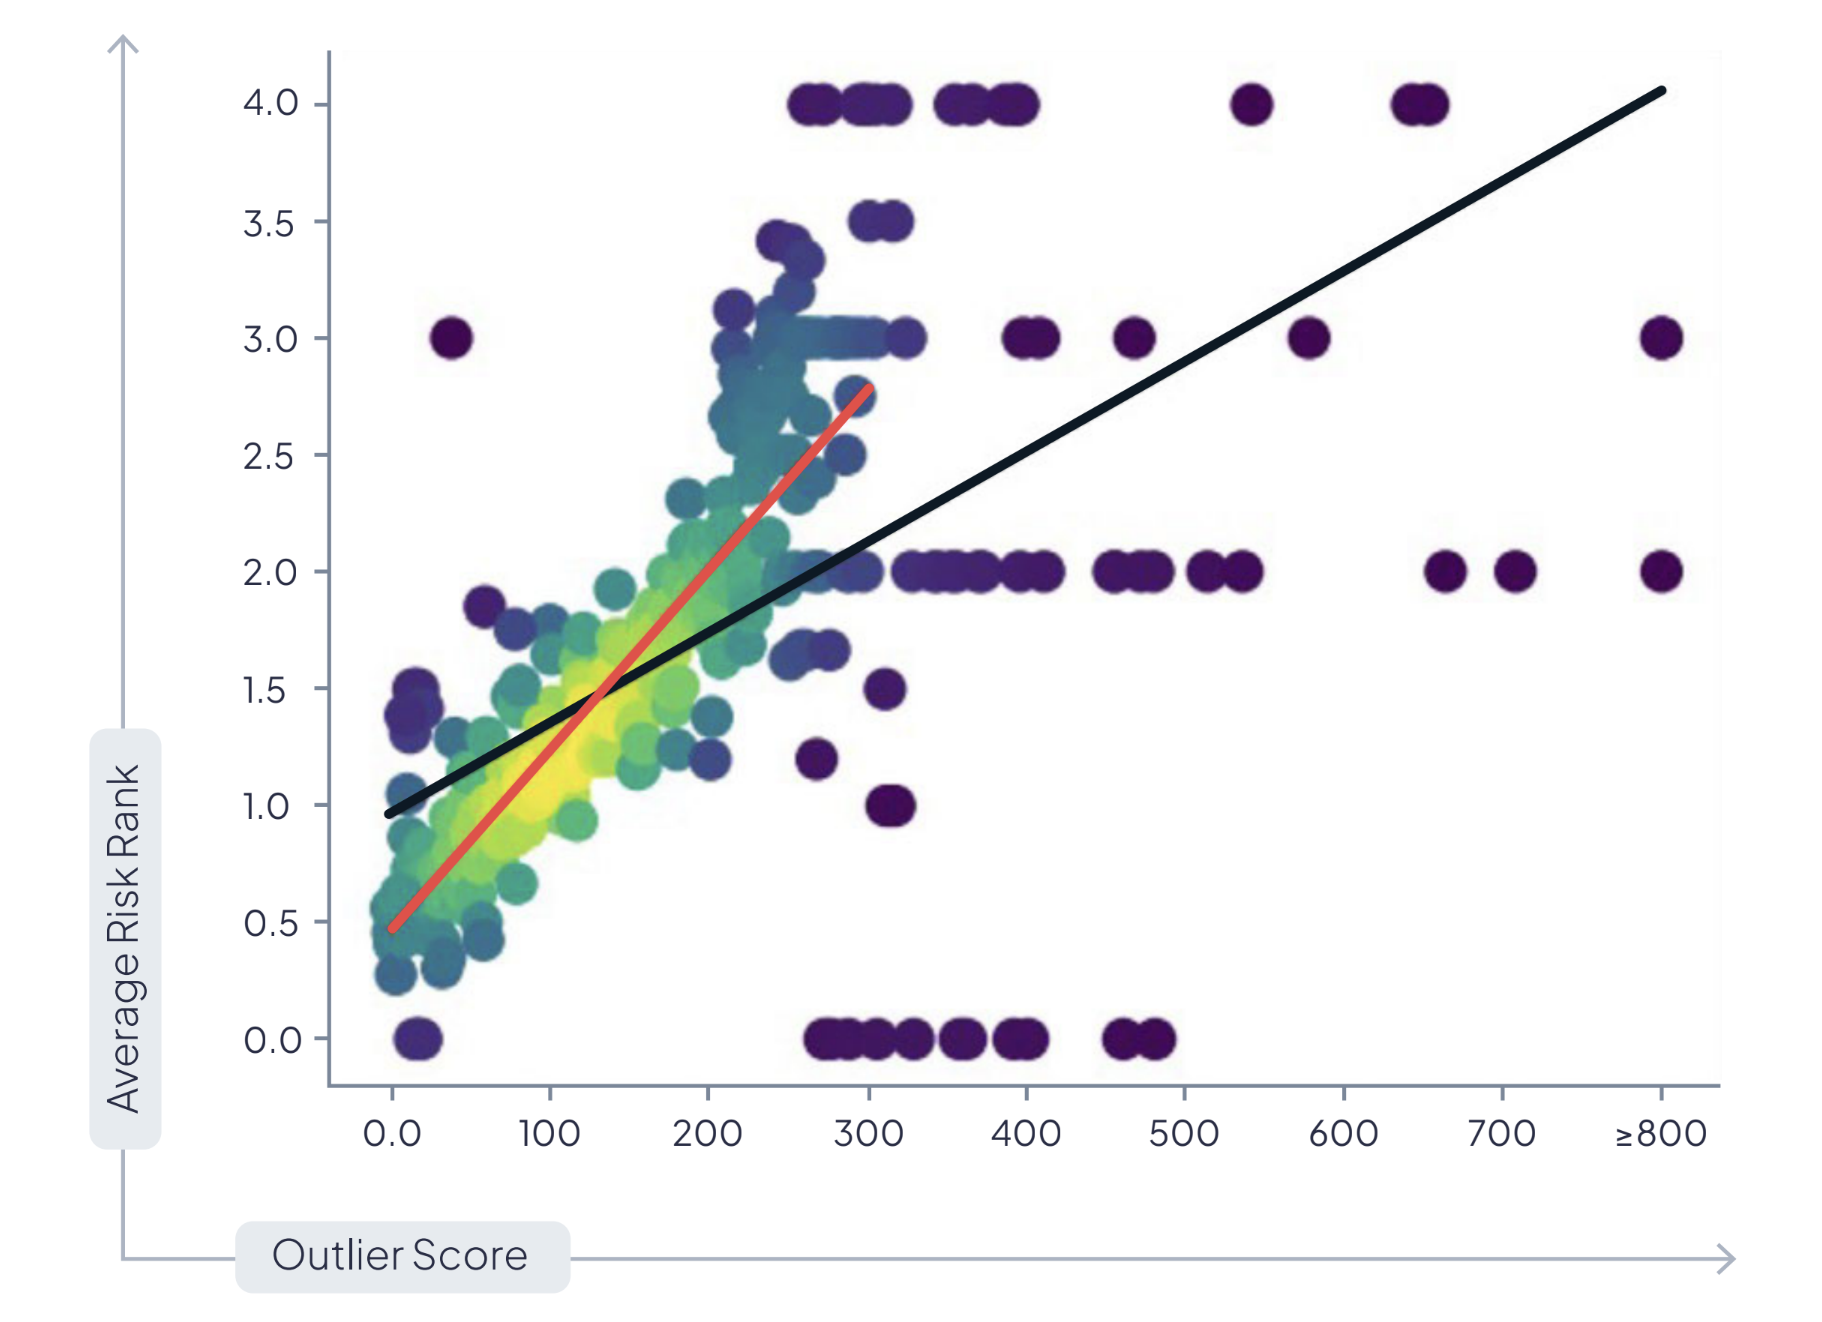
By definition, most assets have a relatively low outlier score, but note that there is a particularly strong correlation between outlier score and risk rank. It is especially notable that very few devices have an outlier score ≥300 without also having a risk rank ≥2.0.
This correlation is particularly notable for its predictive power. In general, an asset with an outlier score ≥250 has a 78% chance of having a risk rank ≥2.0. Importantly, the opposite also generally holds true: an asset with an outlier score of ≤250 has a 69% chance of having a risk rank ≤2.0.
Final thought #
An unusual asset may be riskier than its peers, but that doesn’t guarantee that it will be noticeable. The outlier score can often reveal when assets differ from the baseline in ways that would not necessarily be apparent to security teams: for example, an unusual round-trip time on TCP connections, a slightly different set of services running, and so on.
runZero’s research shows that these assets, even if just slightly unusual, are often significantly riskier than others. The outlier score gives security practitioners a powerful tool to find riskier assets – even when no one else might notice.
Not a runZero customer? Download a free trial and gain complete asset inventory and attack surface visibility in minutes.
