-
Exposure Management Platform
Complete security visibility across IT, OT, IoT, cloud, mobile, and remote assets.
-
Integrations
runZero seamlessly integrates with a wide variety of tools, enhancing network visibility, enriching asset data, and uncovering control gaps.
-
Community Edition
Our completely free version of the runZero Platform is ideal for home use and environments with fewer than 100 assets.

Exposure Management. Redefined.
Overcoming legacy limitations requires a new approach to the attack surface — one that uncovers the hidden exposures you’ve been missing and targets the exploitable risks that matter most to your environment.
-
Solutions
Gain visibility, control the unknowns, and ensure compliance with confidence.
-
Regulatory Compliance
Ensure compliance and stay resilient against evolving cyber threats.
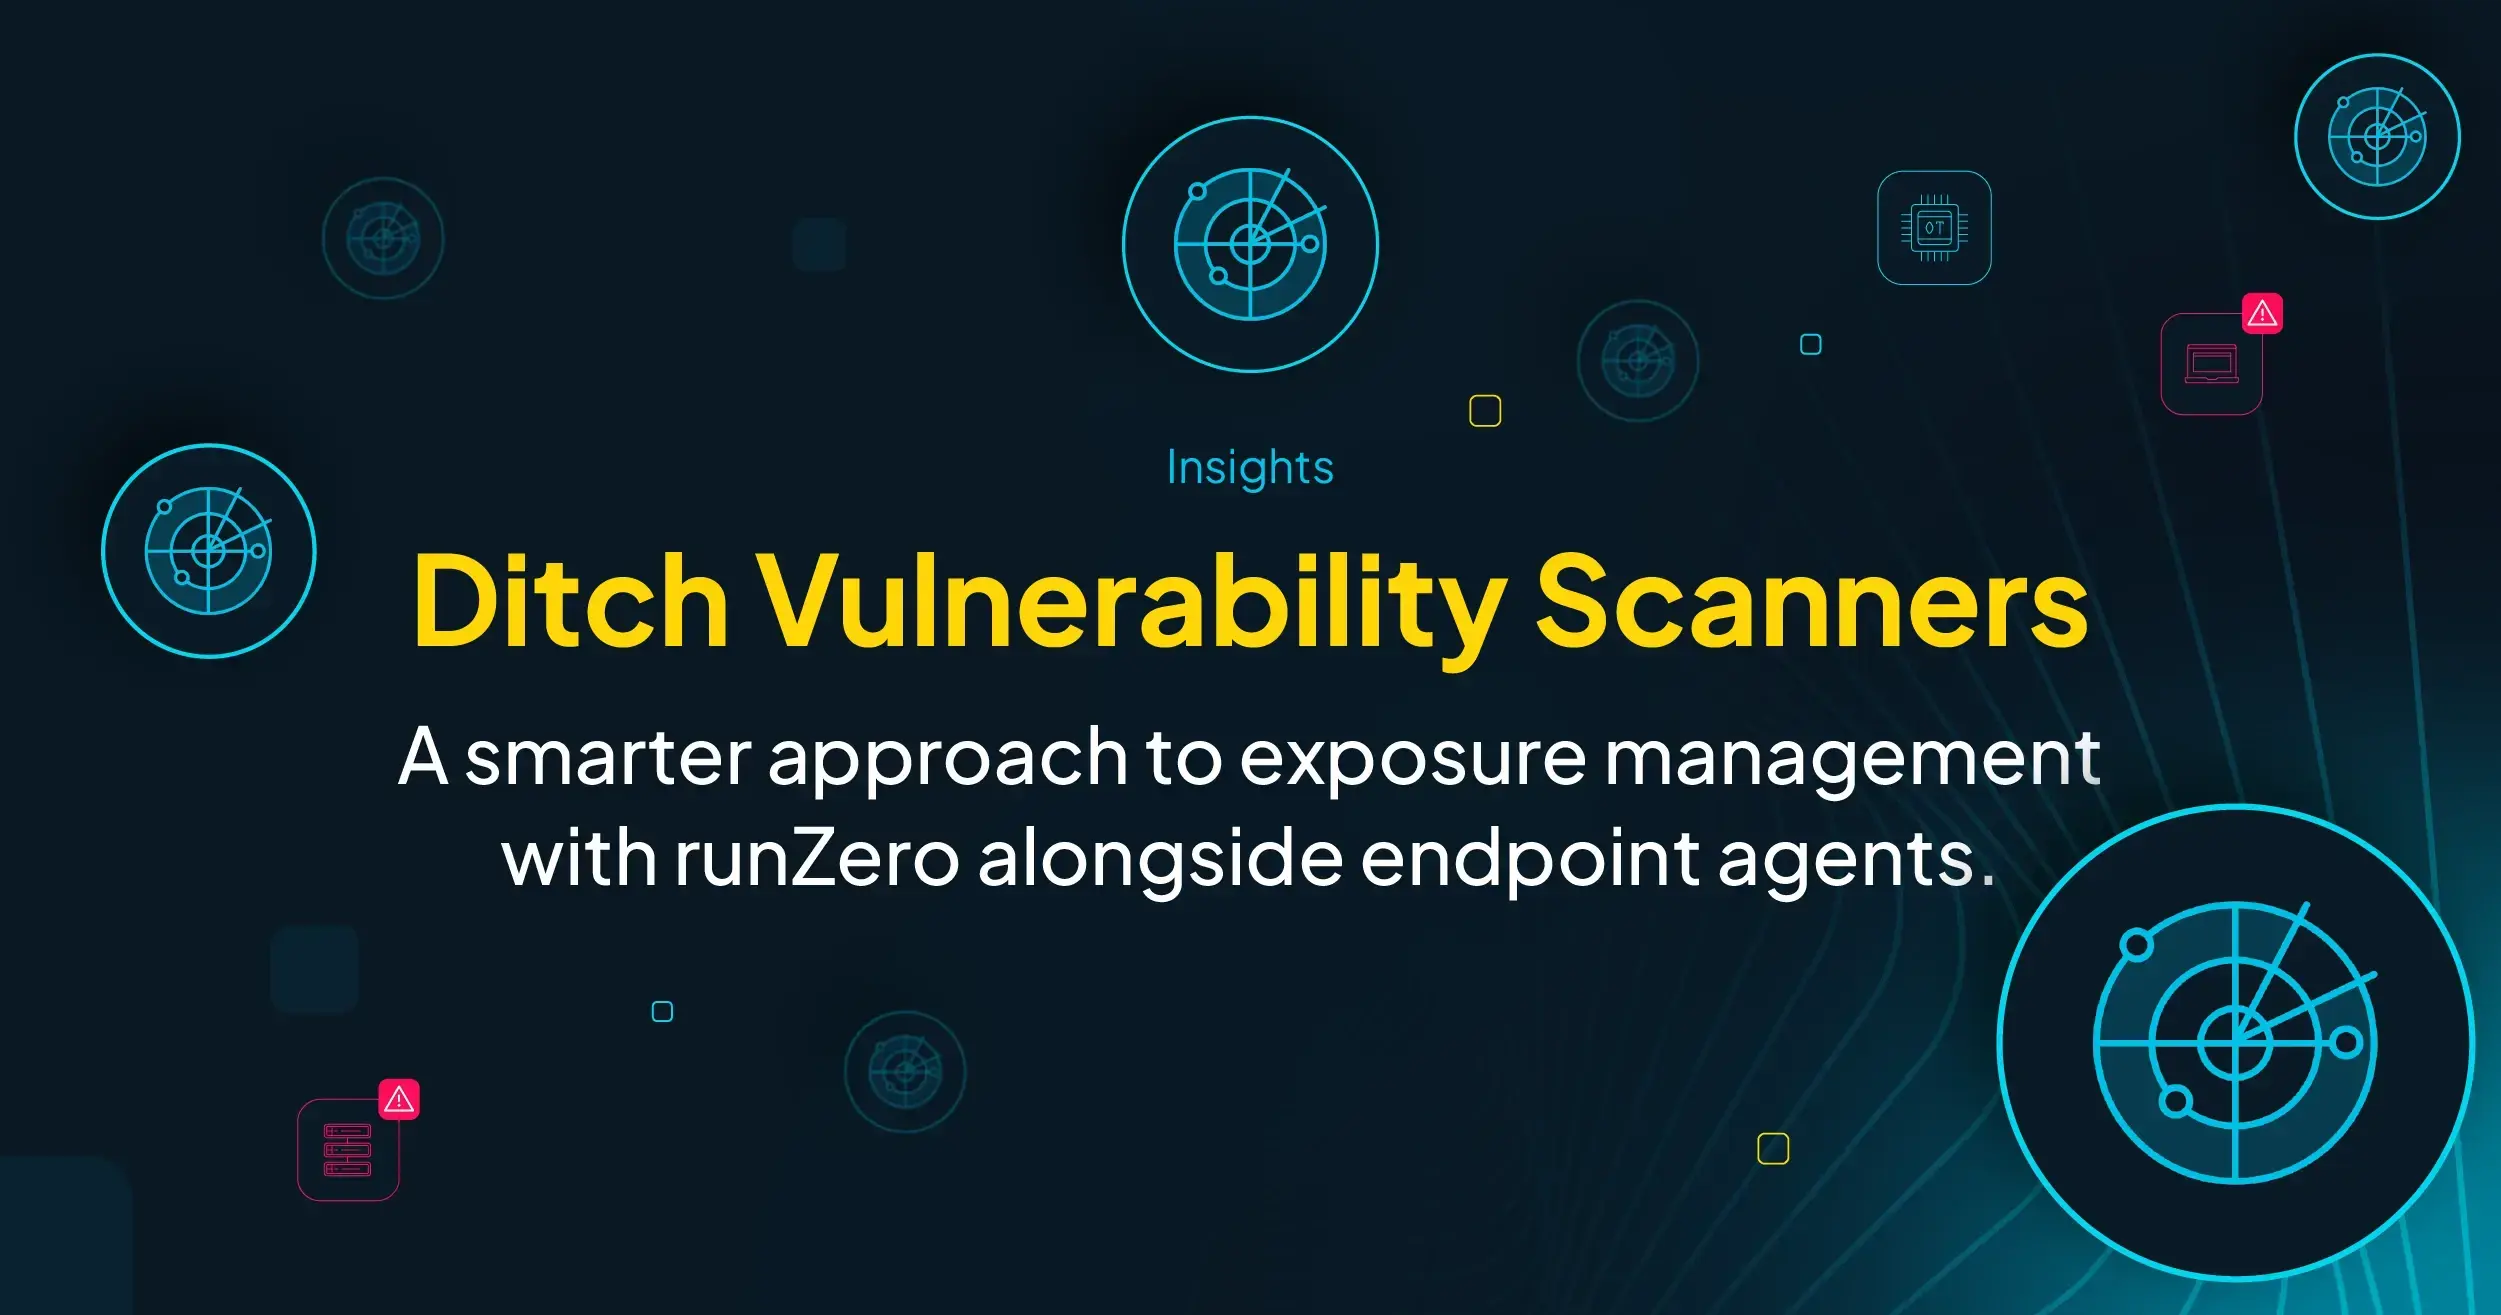
It’s time to move away from legacy vulnerability management
Legacy vulnerability scanners were built for a different time — when networks had clear perimeters, assets were reachable, and credential-based scanning was feasible across the board. That world doesn’t exist anymore.
-
Resource Center
Dive into a treasure trove of resources to expand your exposure management knowledge.
-
runZero Research
Explore the world of exposure management through the runZero lens.
-
runZero Blog
See what's happening at runZero and read up on the latest ideas, opinions, and articles from our experts and researchers.
-
Support Resources
Everything you need to maximize your experience with the runZero Platform.
Watch the runZero Day replay!
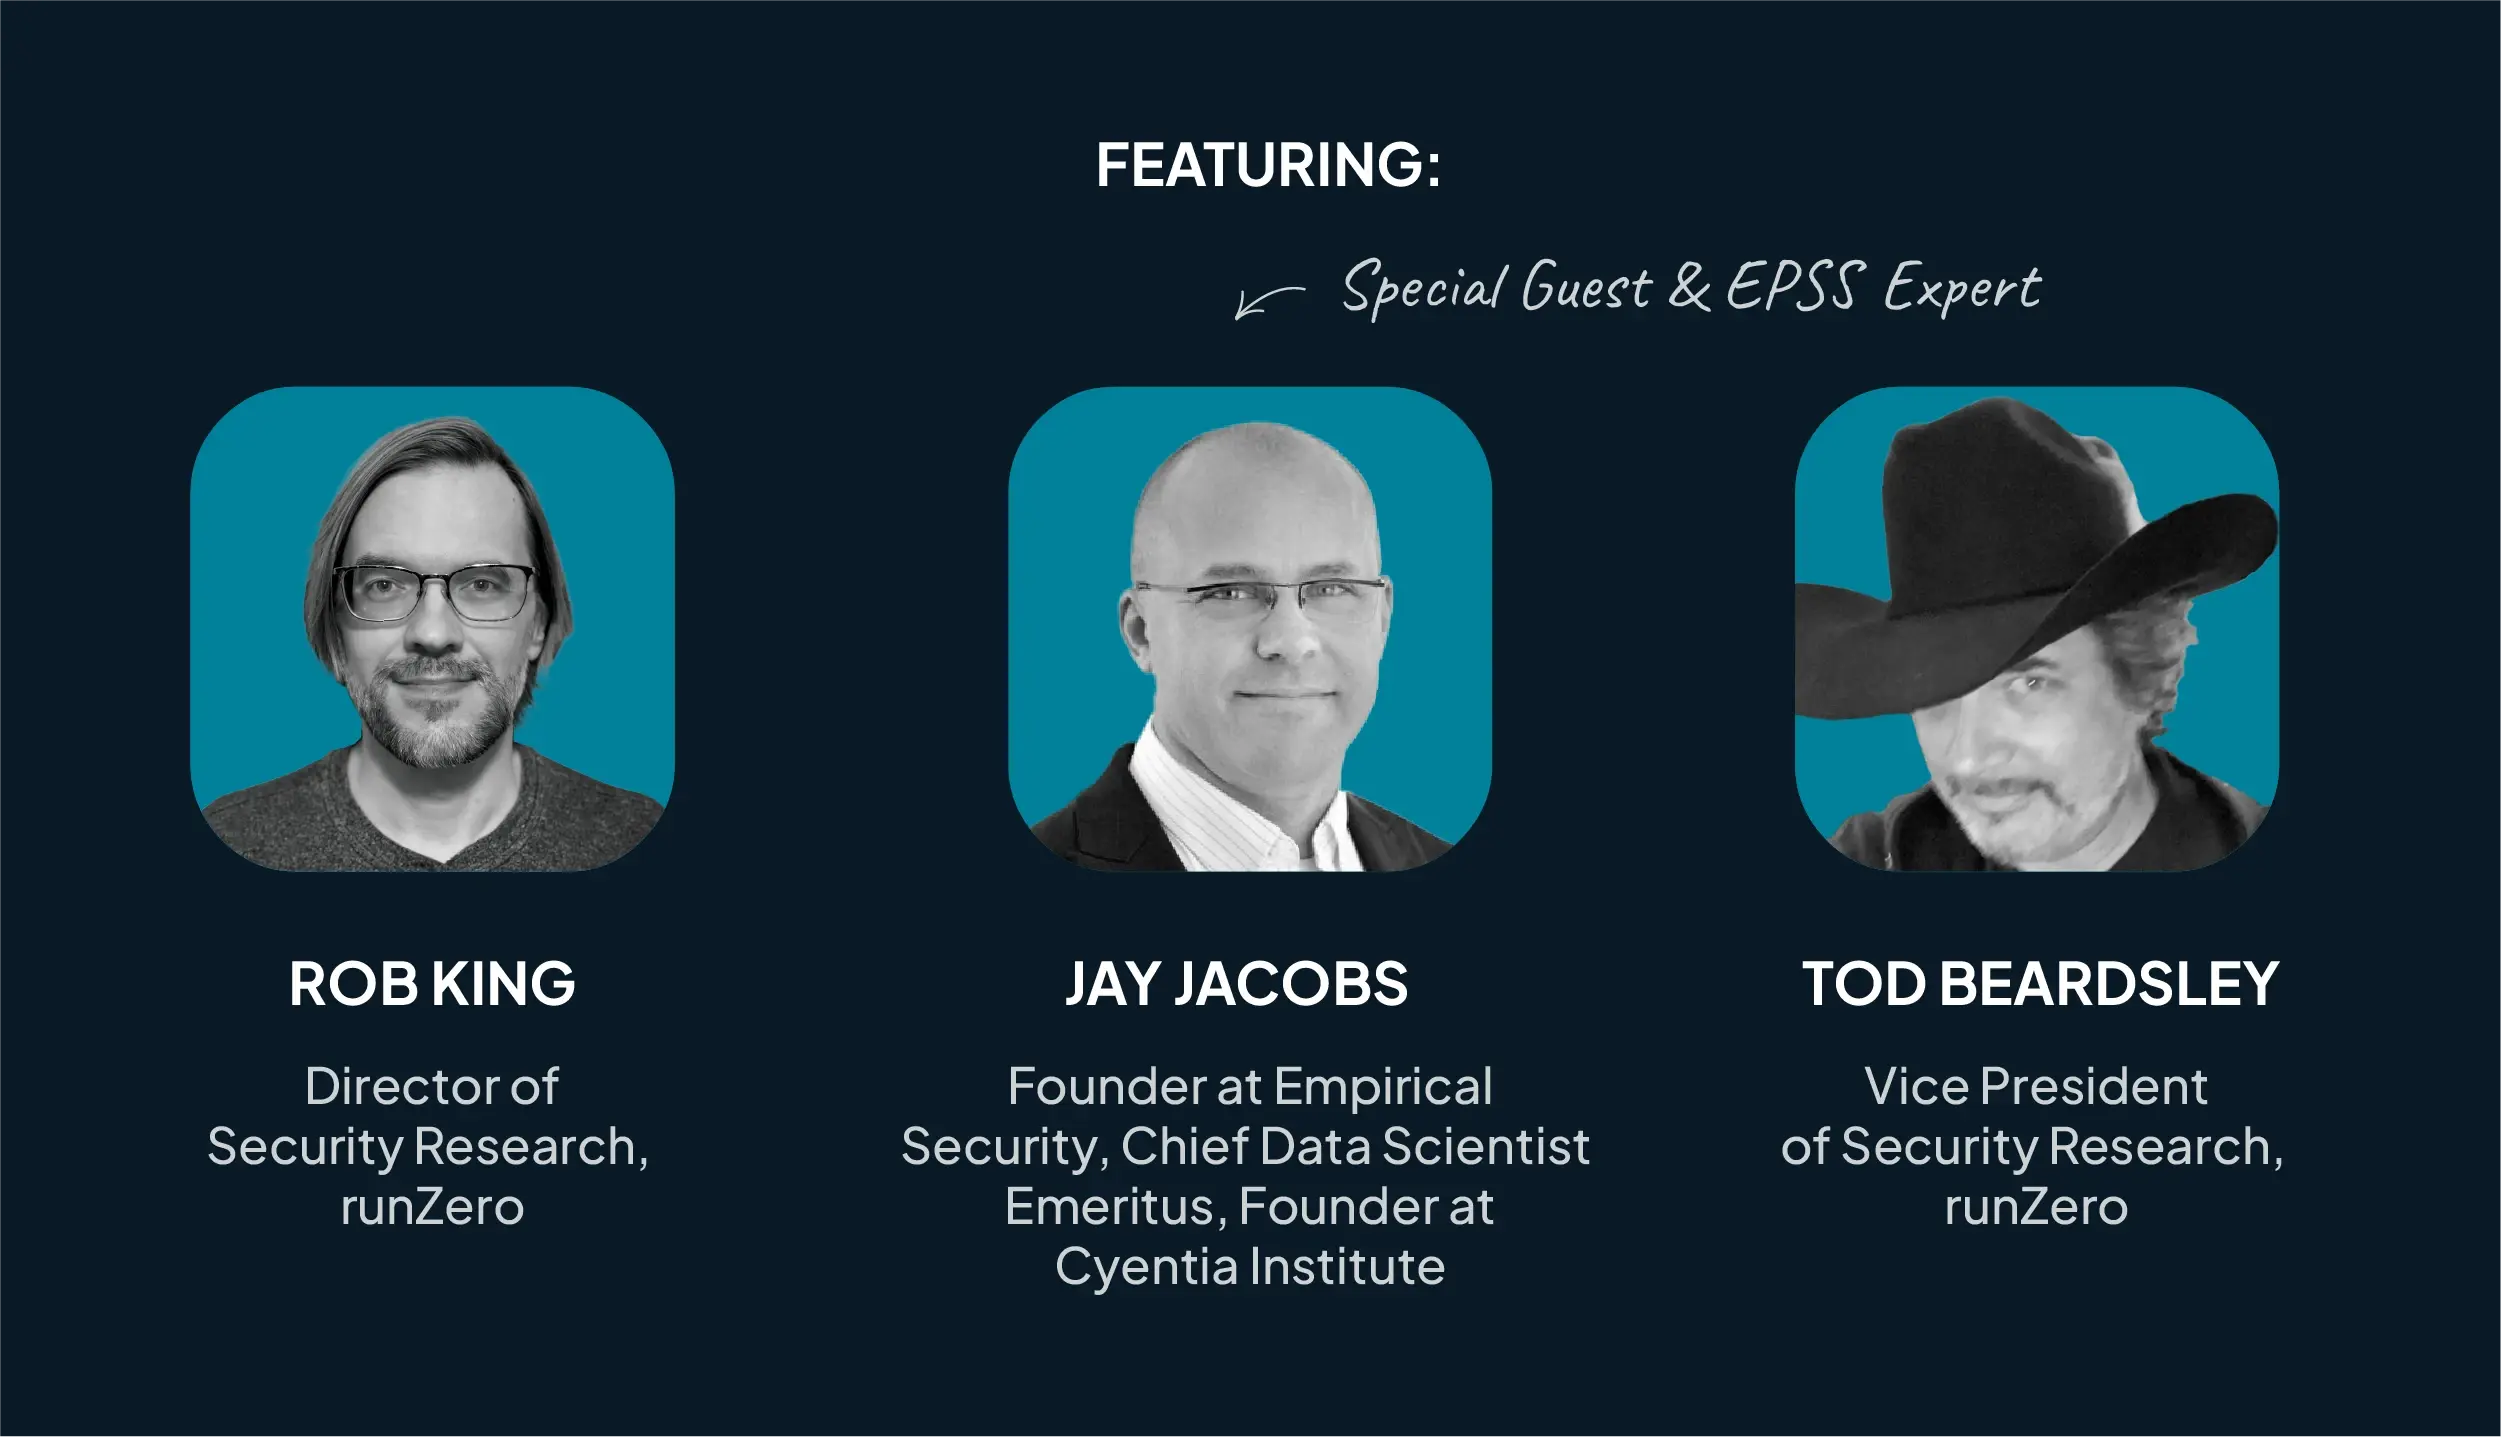
The inaugural runZero Day livestream was one for the books! From the inner workings of the CVE program and modern cyber journalism to the realities of OT security and the startup investment ecosystem, our wonderful guests helped us cover the trends that are defining our industry.
-
Our Customers
Our customers are everything. We're super proud to be trusted by leading organizations around the globe to help them improve their security.
-
Case Studies
See how runZero has empowered security teams to take control of their networks, uncover their unknowns, and save significant time and money.
-
Testimonials
Read reviews of the runZero Platform and see how teams have improved their security with our technology.
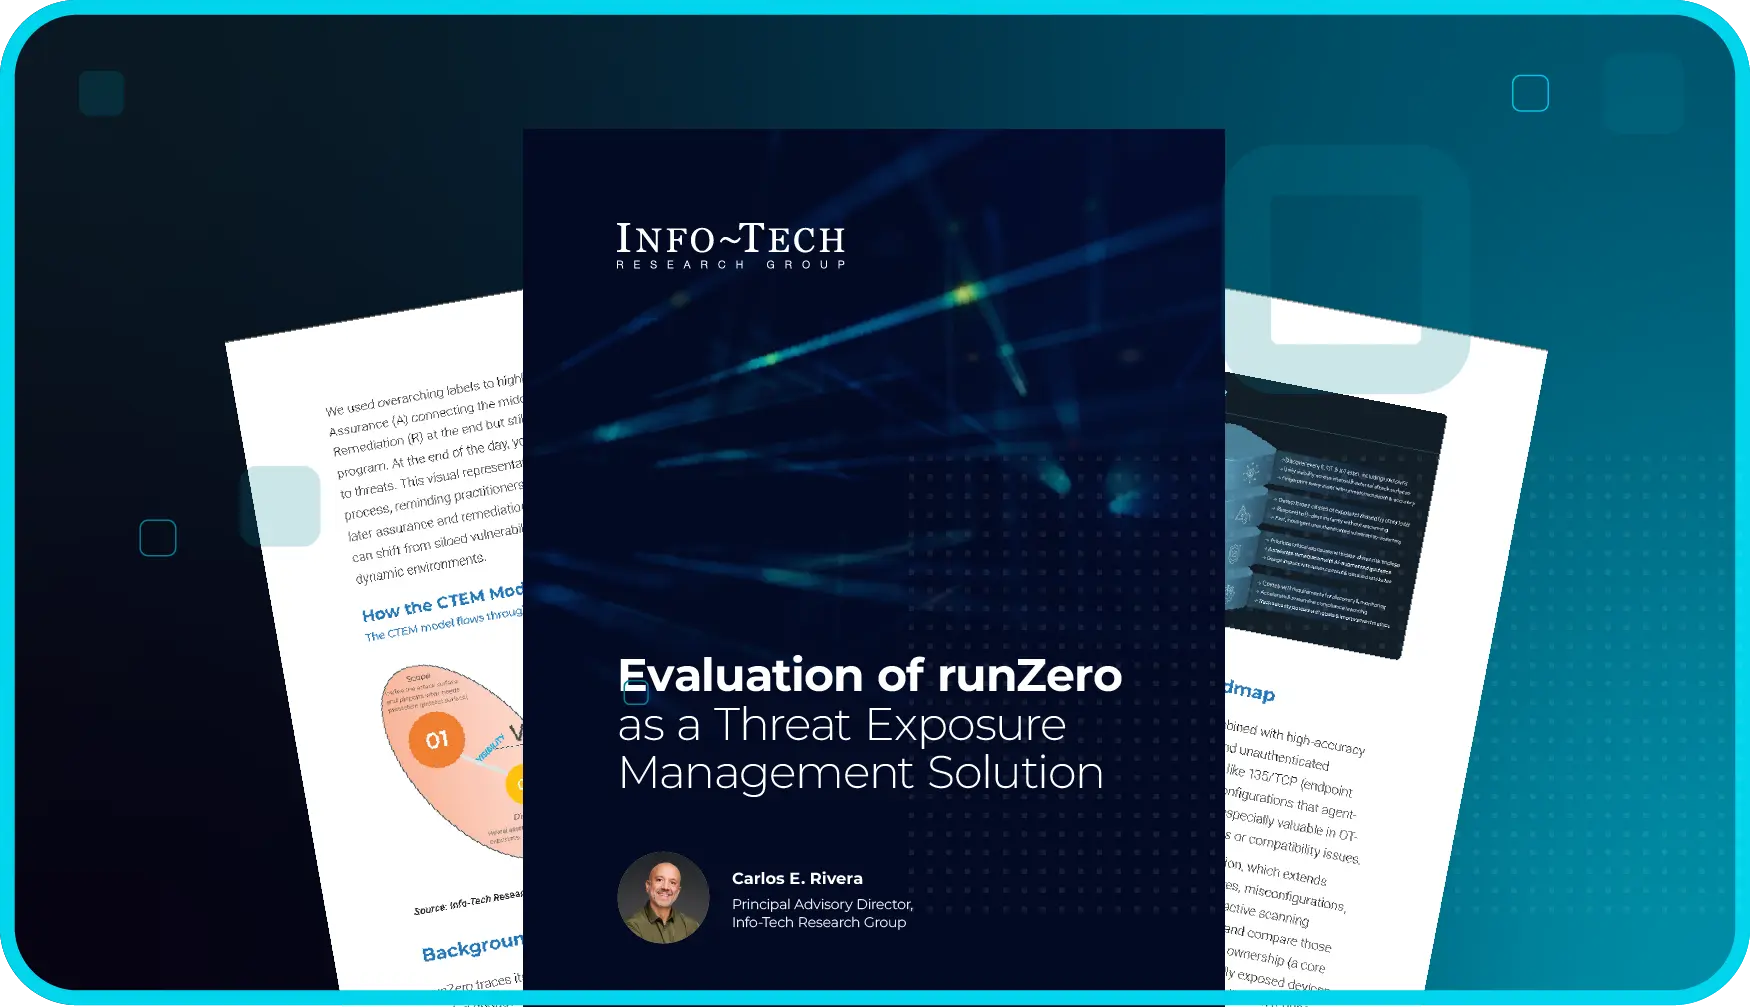
Info-Tech report confirms runZero as a leading CTEM solution
Info-Tech Research Group validates runZero as a reliable vendor solution for complex environments, highlighting its structured approach to CTEM, innovative agentless approach, and ability to detect full-spectrum exposure to deliver comprehensive visibility and rapid threat detection.
-
About Us
Wondering who the heck are these people? Meet the team and get the story behind runZero... once upon a time called Rumble.
-
Events
Track down runZero Yetis in the wild! Join us in-person or virtually at one of our upcoming events.
-
Investors
Meet the cybersecurity investors, trailblazers, and innovators who help us navigate our journey and the evolving security landscape.
-
Newsroom
Read the latest articles, announcements, and press releases from runZero.
-
Careers
Want to join our forces? We're looking for bright minds and passionate souls who want to write the next chapter in exposure management.

Tune in on April 15 – Live, Laugh, Malware: LLMs in Cybersecurity
Join Tod Beardsley and Rob King as they welcome Caroline Wong to discuss the dual nature of AI’s capabilities, and provide an update on the evolving CVE ecosystem. Plus, bring your best AI-game to our live trivia contest for a chance to win a signed copy of The AI Cybersecurity Handbook!
-
Infinity Partner Program
See how we can work together to provide best-in-class security solutions and outcomes for our joint customers.
-
Partner Directory
Explore our directory of trusted (and awesome) partners.
-
Partner Sign In
Sign in to our Infinity Partner Portal.
Join our Infinity Partner Program
Designed with a partner-first mindset, the runZero Infinity Partner Program offers incredibly valuable resources, relationships, and rewards to partners who choose to grow their business with us.