ToneLoc #
The Subnet Grid Report introduced in runZero 1.7.0 is copied from one of my favorite security tools of time, ToneLoc! ToneLoc (the tone locator) is MS-DOS wardialer written by Minor Threat and Mucho Maas that was released in the early 90s. ToneLoc was (and sometimes still is) one of the best ways to sweep telephone ranges to find accessible modems.
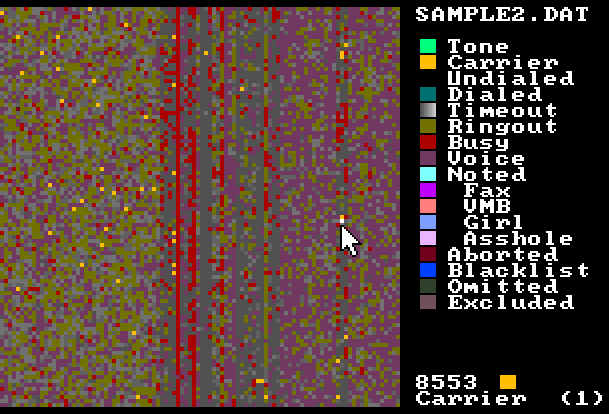
One of the coolest features is ToneMap; a 100x100 pixel grid display of a 10,000 telephone number block. For a given number block (1-512-XXX-XXXX), the top left pixel would represent 1-512-000-0000, while the bottom right would be 1-512-999-9999.
The ToneMap visualization made it easy to identify anomalies and detect patterns in the allocation of phone numbers. The image below is a screenshot of ToneLoc's ToneMap (1.10) running in DOSBox with a sample data file.
WarVOX #
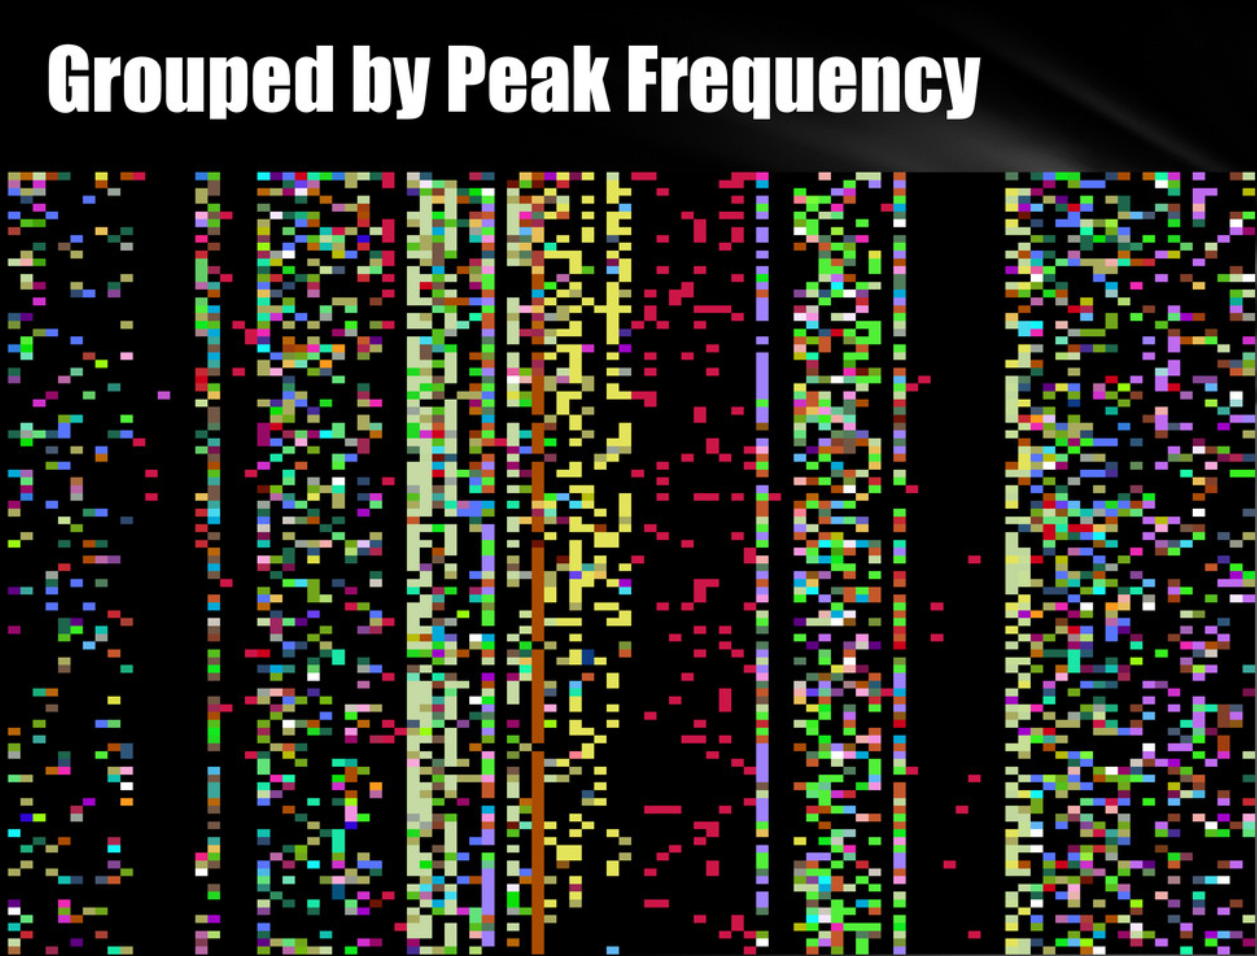
Fast forward to 2011 and I borrowed the ToneMap visualization when building out WarVOX (a VoIP-powered wardialer, currently unmaintained). Visualizing the peak frequency and silence-to-noise ratio as a ToneMap-style grid uncovered interesting patterns in phone number allocations. Similar audio (errors, answering machine, voicemail boxes) could be quickly extracted, while the peak frequency grid view made it easy to find dial tones, modems, and other digital endpoints. This feature never made it into the application, but was heavily used as part of the development process.
runZero #
runZero takes a similar approach in the Subnet Grid Report. This grid view differs in few ways, but the core concept is the same. In contrast to telephone numbers that are often organizated on multiples of 10 boundaries, IP addresses are organized on powers of two subnet sizes. The runZero report aligns the grid to standard CIDR subnet sizes and can scale from 16 to 512 columns as needed.
The screenshot below shows a public IPv4 subnet with the OS color map applied. The blue squares on the left and right edges are Cisco routers while most of the remaining IP space is full of Huawei Home Gateways, mapping to a typical residential ISP block, at least in Iceland where this subnet is allocated.
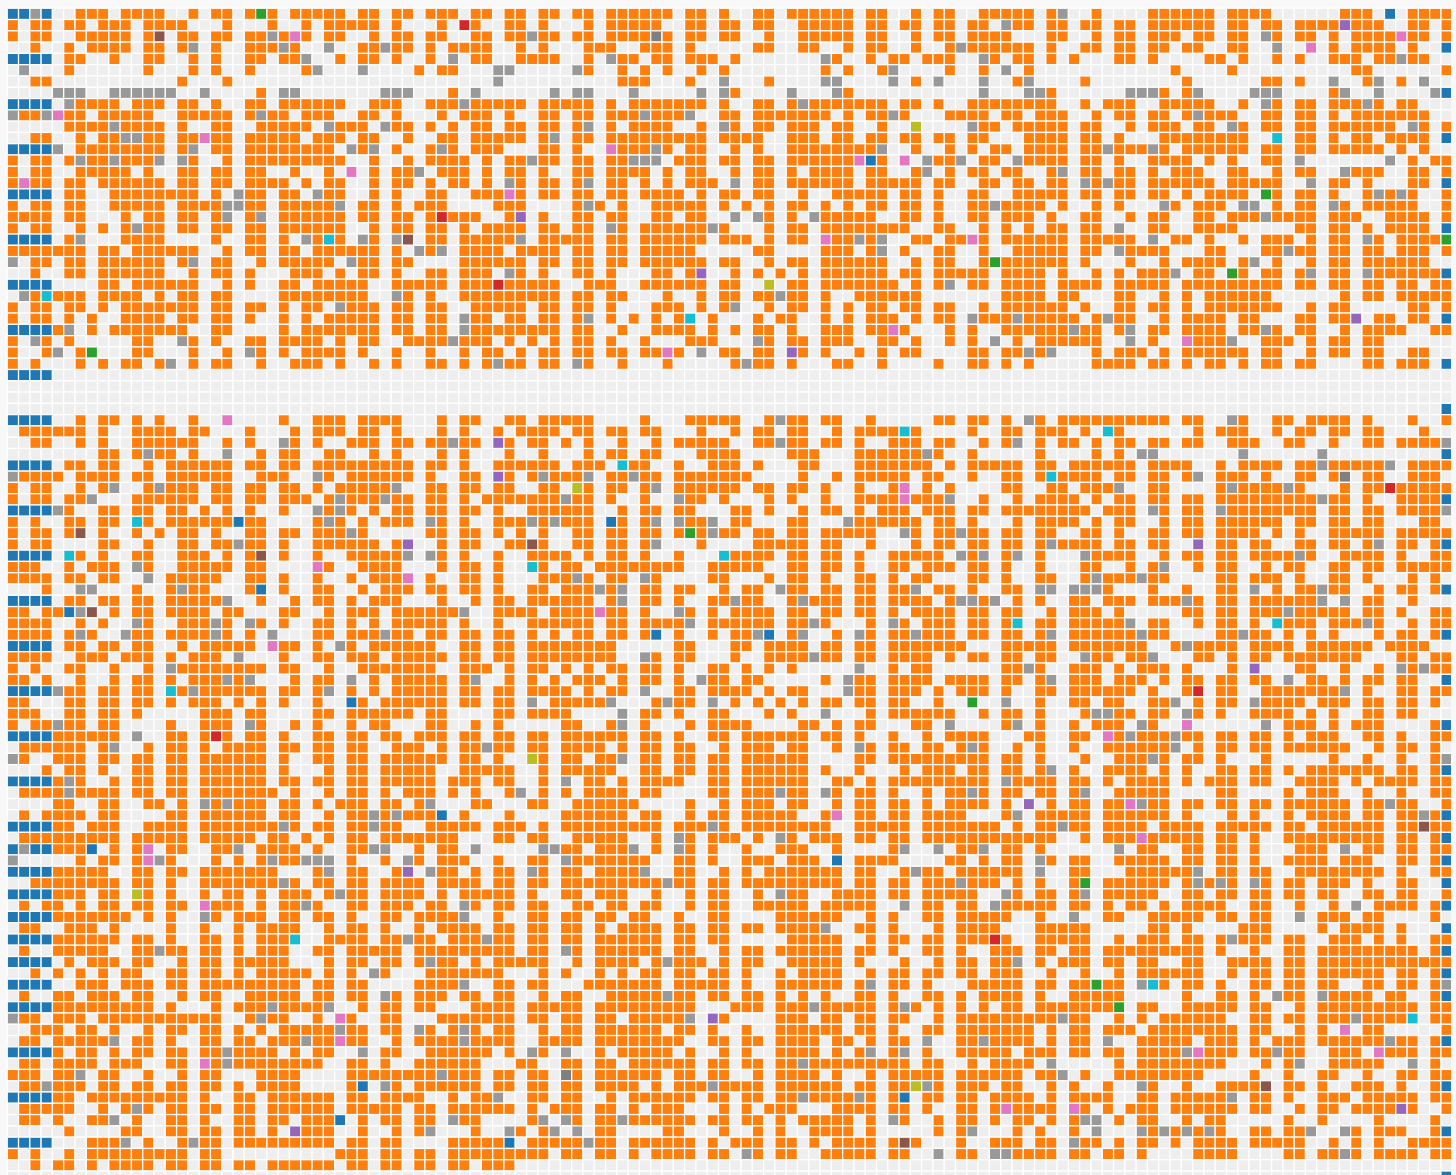
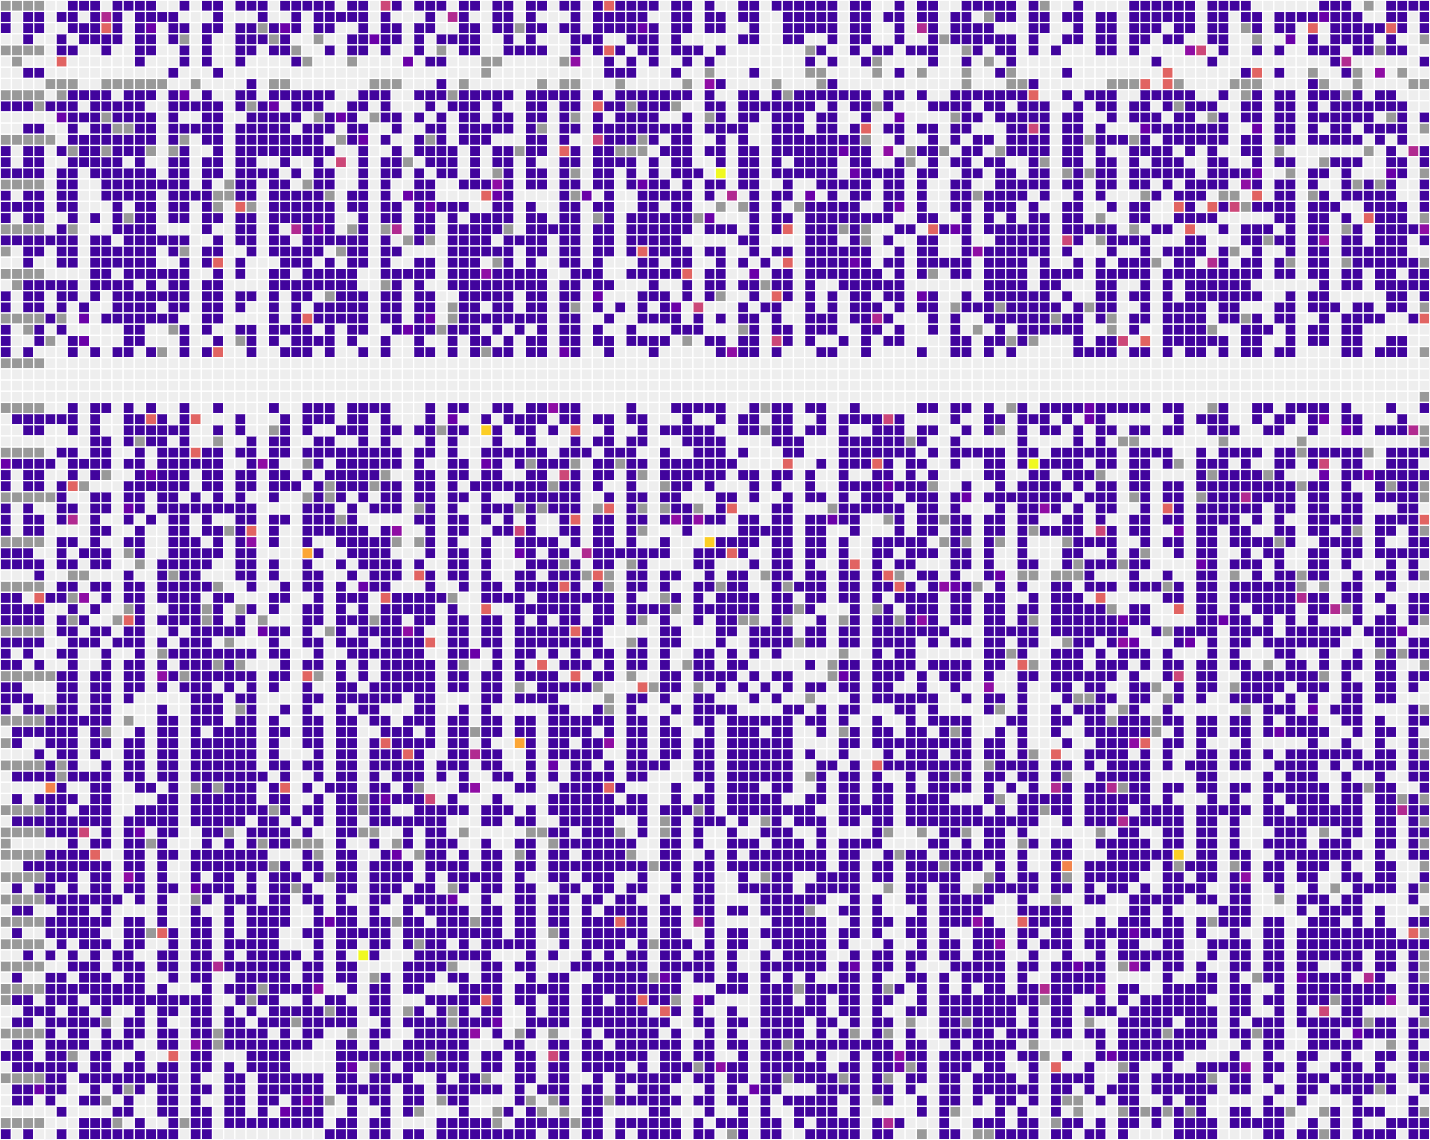
Cycling between different color modes can highlight interesting patterns. The default mode is to color map by TCP service count. Darker nodes have less services, while brighter nodes have more. If you are trying to identify potential exposure, more services generally correlates with a higher risk. The Services color map does not differ much from the OS map; we can see that Cisco routers on the network boundaries have no TCP services, while most of the Huawei devices have exactly one.
Given that the assets on this network are mostly detected as Huawei Home Gateways, lets filter those out and apply the OS color map:
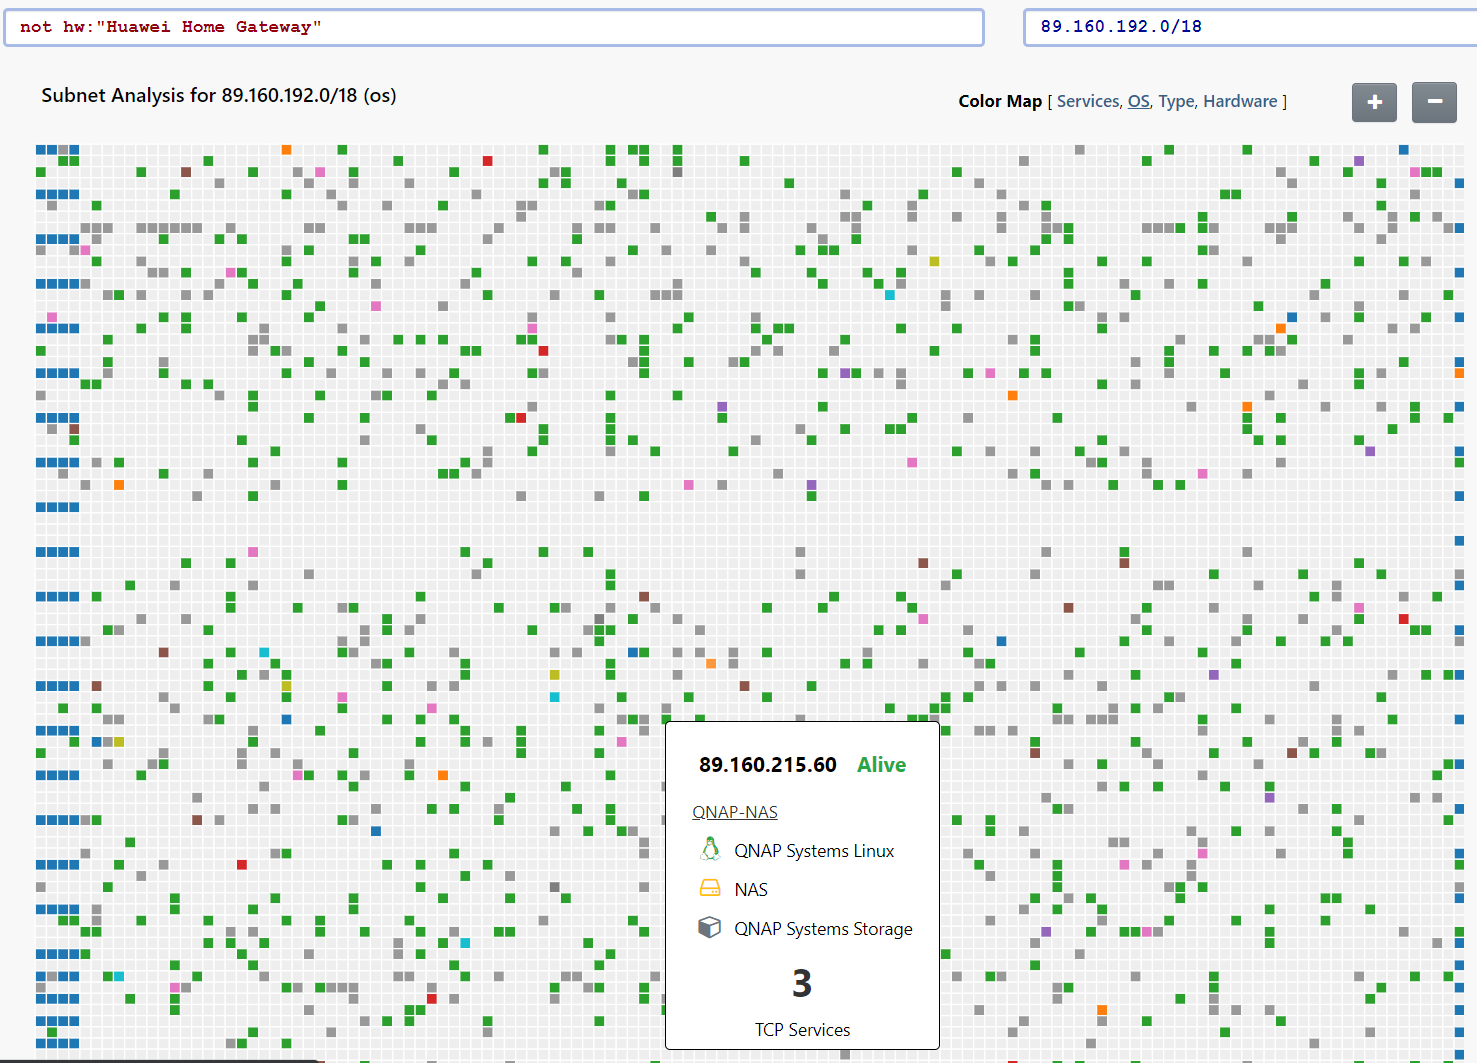
Neat! Our Cisco routers on the boundaries are still there, but now we see a scattering of "different" devices. Most are these are still hosted behind the Huawei Gateways, but the use of port forwarding causes runZero to reclassify them as something else, based on what ports are forwarded and the device listening on the far end.
In this case we see a QNAP NAS device exposed to the internet through port forwarding.
It looks like there might be a diagonal allocation pattern of responsive IPs. Lets try zooming out further:

Wow! Yup. Whatever this ISP is doing for DHCP allocation is causing addresses to be staggered from one subnet to the next. Some of the insights that can be pulled from a grid visualization are nearly impossible to notice through other analysis methods.
Although we have been using an external IPv4 subnet for this example, this type of analysis is incredibly useful for internal networks too. Anomalies are easy to spot and the filtering capability can be used to remove noise as needed. This final example is from a typical office network, with the Type color map applied.

The blue blocks are Windows desktops, the pockets of red and orange are printers and network scanners, while the gray items are Linux servers. A quick glance gives us an idea of how this network is used and makes the outliers obvious.
Full Circle #
ToneLoc (and ToneMap) have been weirdly influential on my work and I thought it might be fun to bring a bit of 2020 back to 1995. We are going to need DOSBox, a ZIP download of ToneLoc from Github, and some data.
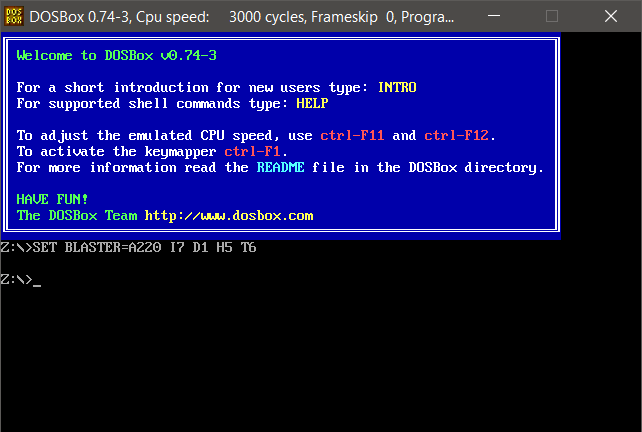
First thing we do is install DOSBox and open the DOSBox terminal.
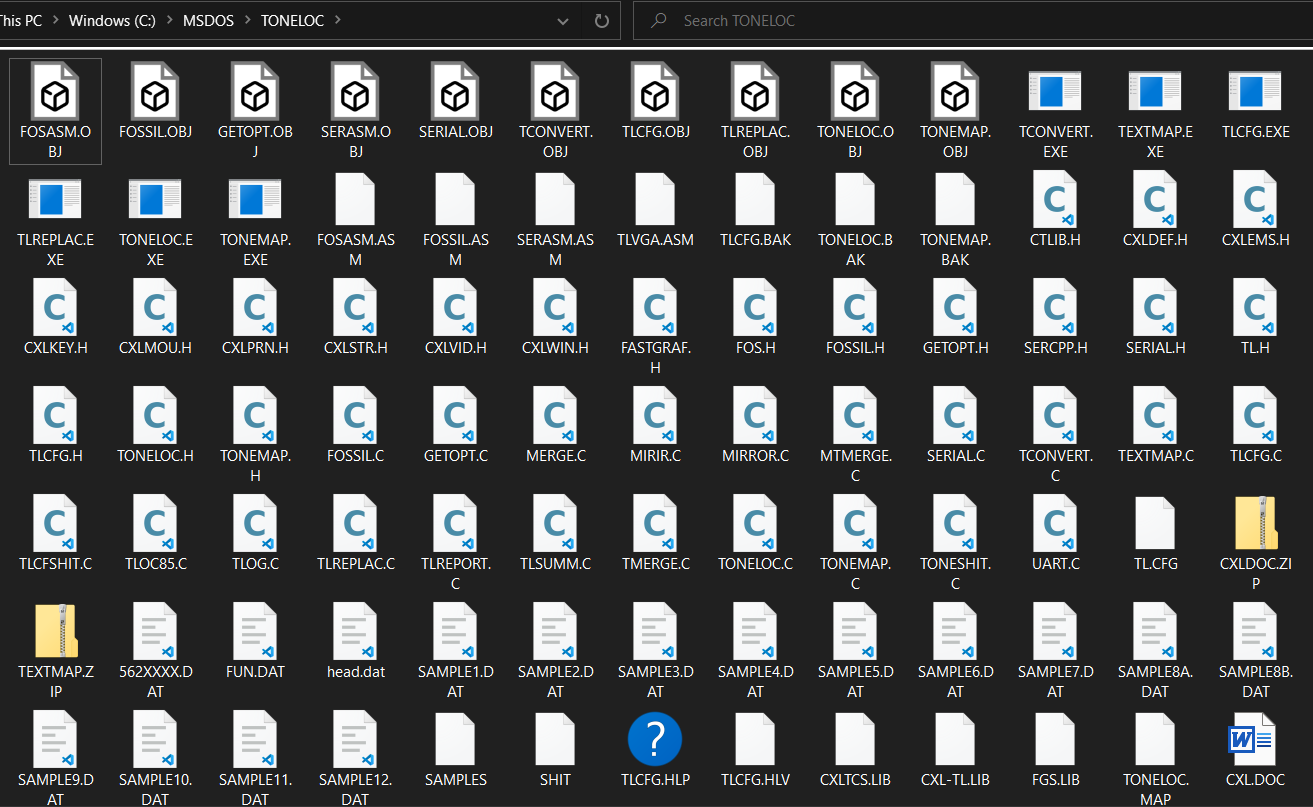
Next we create a local directory and extract the ToneLoc ZIP file into it. I picked C:\MSDOS\ToneLoc.
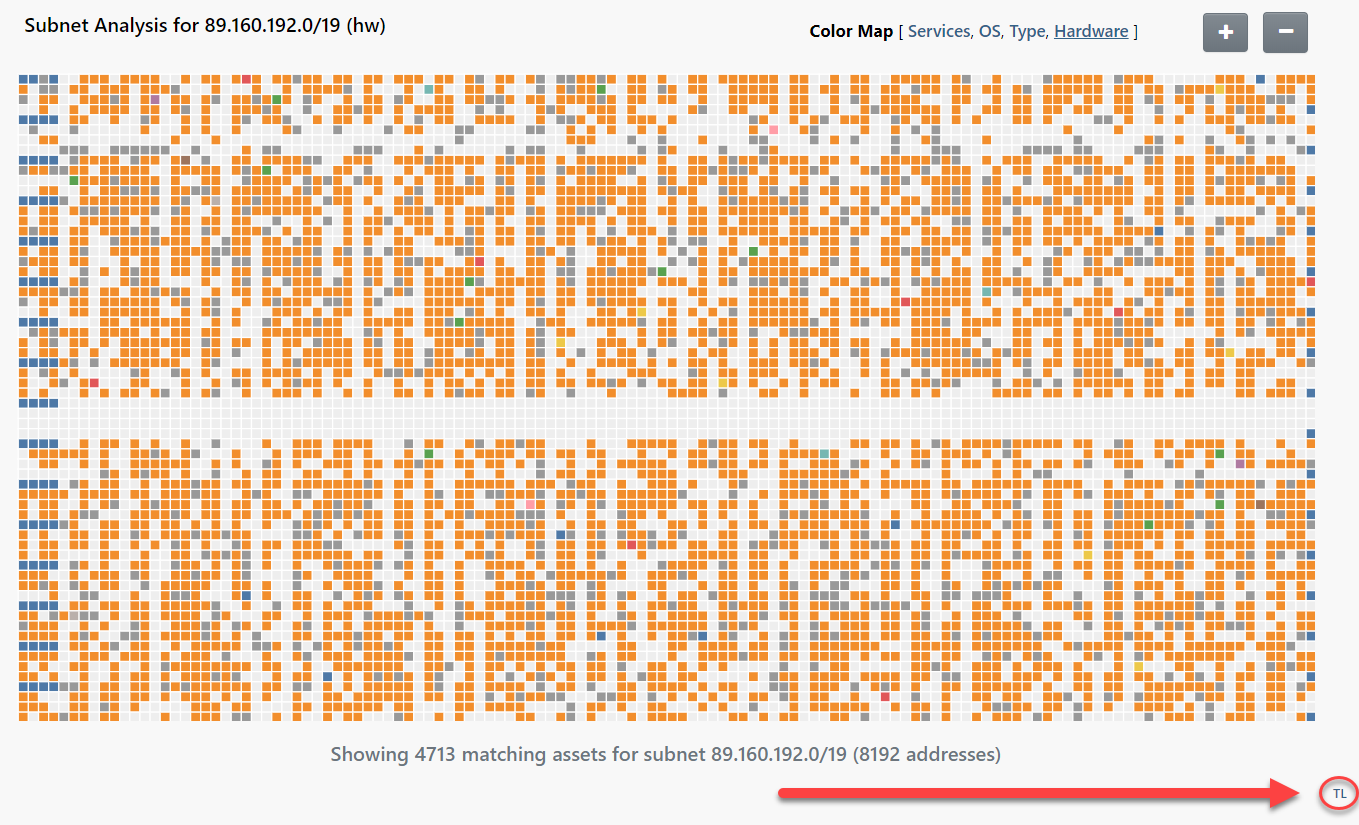
Now we need some data. Head to the Subnet Grid Report for your favorite subnet, click the OS color map, and use the TL link in the bottom right to download a os.dat file.
Copy this file into the ToneLoc directory (C:\MSDOS\ToneLoc) as os.dat.
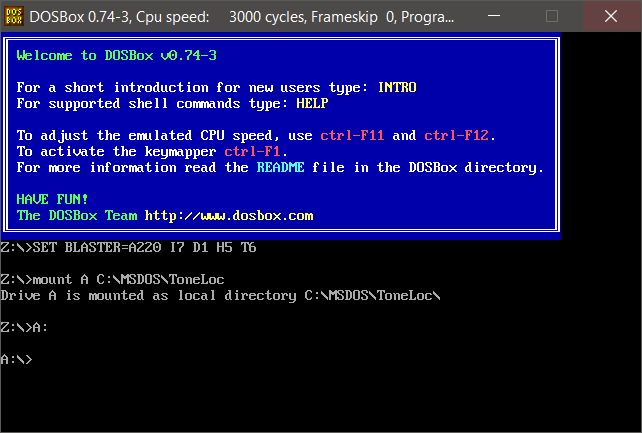
Now mount the ToneLoc directory in DOSBox and change into it:
Finally, run tonemap os.dat:
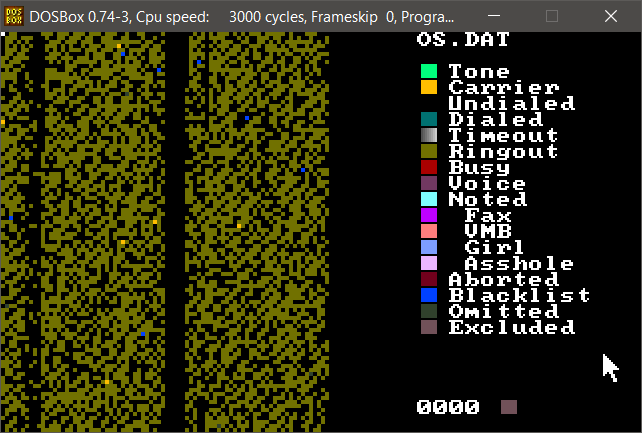
You can switch the color map to Service mode and get a different perspective by loading services.dat:
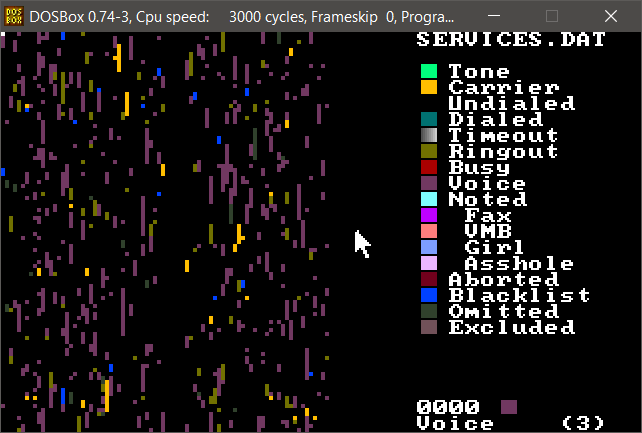
Success! We have IPv4 network scan data from 2020 visualized in a 1990s wardialer.
What is old is new again.
Thanks for reading!
-HD
